The New I-Marker Mapping Tool by Sector

Discussion details
“If we cannot measure it, we cannot improve it”.
The Inequality Marker (I-Marker) was introduced in 2023 to track, measure, and benchmark the impact of DG INTPA’s interventions on inequality reduction. But how do we ensure that these efforts are effectively categorized and visualized?
Enter the I-Marker Mapping Tool – an innovative solution developed by DG INTPA.G4 to structure and visualize sectoral contributions to inequality reduction. By mapping interventions based on I-Marker scores, thematic sectors, and geographic distribution, this tool enhances strategic planning and knowledge sharing across EU Delegations and Headquarters.
Why Do We Need the I-Marker Mapping Tool?
The I-Marker has already provided valuable insights into how EU-funded actions address inequality:
- 59% of actions committed in 2023 had a substantial focus on inequality reduction, marked as either I-1 (significant objective) or I-2 (principal objective).
- However, there was no structured sectoral categorization of these actions, making it difficult to assess sectoral contributions and best practices.
Without a clear data-driven classification, strategic planning lacked the necessary sector-based insights to effectively guide policy and funding decisions.
To address these challenges, DG INTPA.G4 developed a dual approach:
1. Sectoral Categorization of Action Documents
- Over 300 action documents have been manually classified by sector and I-Marker score.
- This categorization allows for a clearer understanding of how different sectors contribute to inequality reduction.
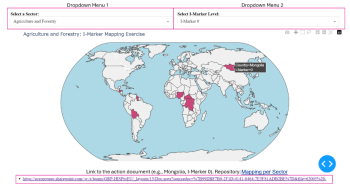
- A Visualization Tool for Better Insights
- A Python-based interactive mapping was created to display interventions by sector, country, and I-Marker score.
- Users can click on a country to view relevant action documents, making it easier to identify best practices.
By leveraging these two components, EU Delegations can now explore sectoral contributions in a structured and accessible way, ensuring that inequality reduction remains a priority across all areas of development cooperation.
What Are the Benefits of This Mapping Tool?
This initiative brings several advantages for colleagues:
- Enhanced Strategic Planning: Provides a sector-based overview to guide policy decisions.
- Knowledge Sharing & Best Practices: Allows colleagues to easily reference high-scoring projects and replicate successful approaches.
- Improved Accessibility: The interactive visualization tool enables quick and user-friendly access to relevant interventions.
- Better Tracking of Inequality Reduction Efforts: Ensures that EU actions are targeting the most vulnerable in a measurable way.
See It in Action: Watch the Video Tutorial
To make the I-Marker Mapping Tool even more accessible, we have prepared a short video tutorial demonstrating how to install and use the tool: I-Marker Visualization Tool - Tutorial.mp4
Additionally, we are providing:
- A Step-by-Step Guide for using the visualization tool
- A One-Pager summarizing the methodology behind the tool
Next Steps: How to Get Involved?
The I-Marker Mapping Tool is a major step forward in making our inequality reduction efforts more transparent, accessible, and impactful. However, its success depends on regular updates and contributions from you!
Every time your delegation develops a new Action Document, make sure it’s included in the tool by sending it to Mathilde.COURNUT@ec.europa.eu and Alessandra.LOBINA@ec.europa.eu. This will ensure the tool remains comprehensive and continues to reflect our collective efforts in tackling inequality.
Additionally, we will be organizing a thematic conversation in April or May to present the tool in more detail and answer any questions. Stay tuned for more information!
Log in with your EU Login account to post or comment on the platform.