
Processed GIS data
Processed data
Data format, resolution and reference system
The processed data is available in ESRI Shape vector format (administrative boundaries, populated places, transmission lines) or as ASCII GRID in 1 km resolution. The spatial reference system of the processed data is the "ETRS Lambert Azimuthal Equal Area" as described below.
ETRS Lambert Azimuthal Equal Area
The reference systems of source data are usually different from the target system of an applied model. Global layers (e.g. gridded population, topography, global land cover) are available in geographic coordinates, while national institutes use the cartographic and reference system most appropriate for their regional or national applications, and defined by their own regulations on spatial data (e.g. Uganda frequently uses the reference system given by the following parameters: Projection: Universal Transverse Mercator (UTM), Zone: 36, Reference Ellipsoid: Clarke 1880, Datum: Arc 1960).
In order to further development, editing and analyzing processes, the data mining of source information has been followed by numerous operations of geodata harmonization and integration. Ensuring the spatial compatibility of the different data sources all the original thematic layers were transformed into a predefined metrical spatial reference system.
Since the modelled area (African continent) extends over several administrative regions and countries it was necessary to specify a common reference system. For geo-referenced information of AFRETEP project a coordinate reference system frequently applied in models of the Mediterranean Basin, Africa and South-West Asia [Huld et al., 2005] and which is also corresponding to the European standards [Annoni et al., 2001] has been chosen.
The applied ETRS Lambert Azimuthal Equal Area projection is characterised by the following parameters:
Projection Name: ETRS_LAEA
Projection Type: Lambert Azimuthal Equal Area
Spheroid: GRS80
Datum: WGS84
Radius of sphere of reference: 6378137
Units: meters
Longitude of centre of projection: 18° 00' 00"
Latitude of centre of projection: 00° 00' 00"
False easting: 4321000.0
False northing: 3210000.0
SOCIO-ECONOMIC DATA LAYERSAdministrative areas, boundaries and names
The geo-referenced data set of administrative units of the Map Library project (Map Maker Trust, Scotland) forms an essential component in the development of our model. The entire African data set has been reviewed and updated to reflect the boundaries as per Jan 2007. The boundary status and administrative names have been verified against various sources of information [Map Library, 2007]. The actual polygon set has become an amalgamation of other datasets available in the public domain.
Download the shape file:
afretep_etrs_countries.zip ( ~ 2.7 Mb)
Population
The "Gridded Population of the World: Future Estimates" [CIESIN, FAO, CIAT] data containing UN-adjusted population counts and density grids in Arc/Info GRID format provided the main source for population estimations. The raster data are at 2.5 arc-minutes (~ 4650 m) resolution population densities and population counts in 2005, adjusted to match UN totals. The source data are stored in geographic coordinates of decimal degrees based on the World Geodetic System spheroid of 1984 (WGS84) and have been projected (ETRS Lambert 18,0) and resampled (1000 m) representing the estimated number of population in each cell in 1 km resolution.
Download the 1 km gridded data:
afretep_etrs_1km_popdens.zip ( ~ 3.5 Mb)
Note: A gridded data set on total population is provided by the AfriPop Project.
Link to the latest map and data: http://www.worldpop.org.uk/
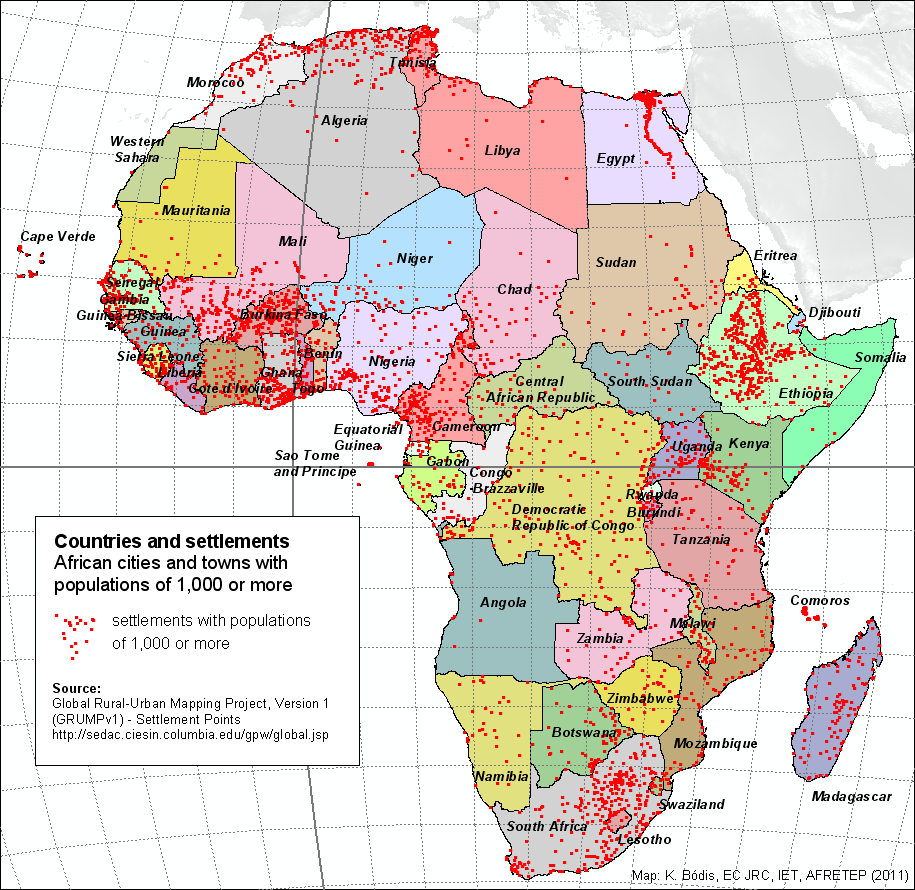
Populated places
Locality and name of point objects (e.g. populated places, administrative centres, churches, schools, military bases) were available from the Map Library data set without population information. The layer of cities from ESRI data set [ESRI, 2006] with classes of estimated population has been processed additionally.
The human settlements database provided by CIESIN, Columbia University is the source of the map of African cities and and towns with populations of 1,000 or more. The Global Rural-Urban Mapping Project, Version 1 (GRUMPv1) project resulted the above described gridded population data too.
Download the shape file:
afretep_etrs_populated.zip ( ~ 18 Mb)
afretep_etrs_settlements-pop-gt-1000.zip ( ~ 18 Mb)
Note: A gridded data set on total population (not only cities) is provided by the AfriPop Project.
Link to the latest map and data: http://www.worldpop.org.uk/
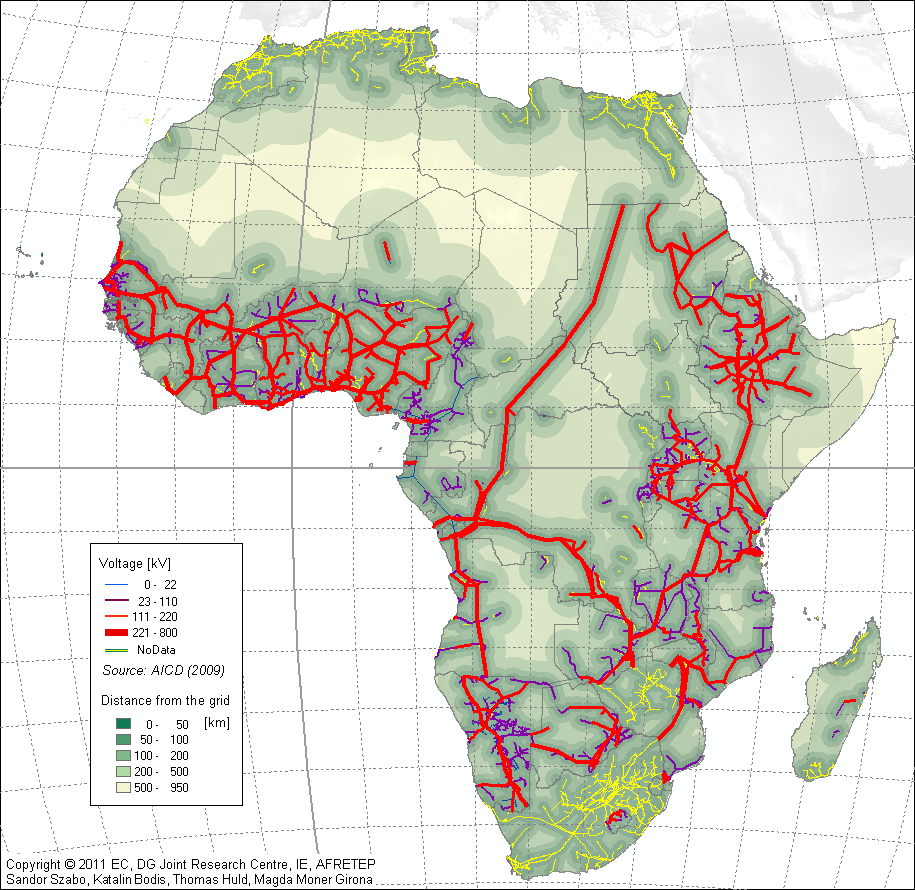
Network infrastructure
The main source of applied African network infrastructure was the GIS database of the Africa Infrastructure Country Diagnostic (AICD), an innovative knowledge program to improve public understanding of Africa’s infrastructure situation. The AICD database provides cross-country data on network infrastructure for nine major sectors: air transport, information and communication technology (ICT), irrigation, ports, power, railways, roads, water and sanitation.
The database covers 24 countries: Benin, Burkina Faso, Cameroon, Cape Verde, Chad, Democratic Republic of Congo, Côte d'Ivoire, Ethiopia, Ghana, Kenya, Lesotho, Madagascar, Malawi, Mozambique, Namibia, Niger, Nigeria, Rwanda, Senegal, South Africa, Sudan, Tanzania, Uganda, and Zambia (April, 2010). Only public domain data has been placed on the website [AICD, 2009] of the AICD, hence not all of the layers available in the database are available in GIS form for our current study.
Two thematic layers were applied from the AICD database:
Power: Power plants (point objects), Transmission network (linear objects)
Transport: Roads (linear objects)
The source of Namibian infrastructure data (national electricity grid network; distribution stations along the national electricity grid network; and electricity power stations) was the Digital Atlas of Namibia published by the ACACIA (Arid Climate, Adaptation and Cultural Innovation in Africa) project [ACACIA, 2009]. The attribute data indicates the capacity of the transmission lines.
Download the shape file:
afretep_etrs_transmission.zip ( ~ 360 Kb)
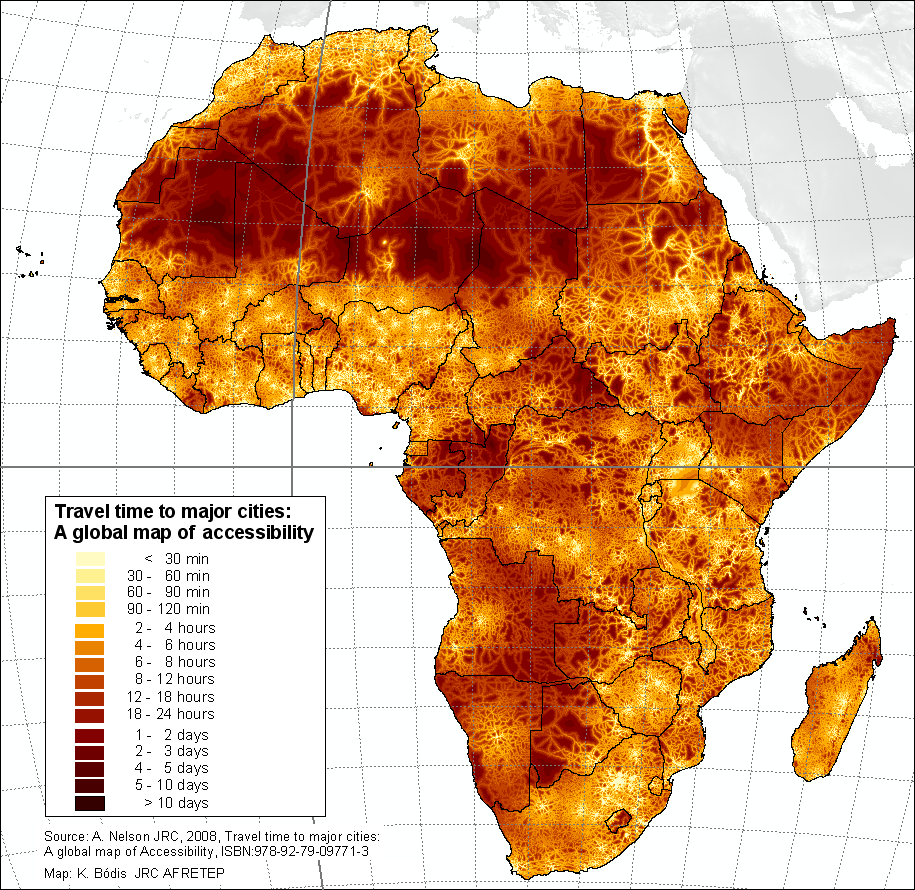
Travel time to major cities: A global map of accessibility
The accessibility is defined as the travel time to a location of interest using land (road/off road) or water (navigable river, lake and ocean) based travel. This accessibility is computed using a cost-distance algorithm which computes the "cost" of travelling between two locations on a regular raster grid. Generally this cost is measured in units of time and a raster grid representing the cost is often termed a friction-surface. The friction-surface contains information on the transport network and environmental and political factors that affect travel times between locations [Nelson, 2008]. The source data are in geographic projection with a resolution of 30 arc seconds. The format is integer Arc/Info GRID format with pixel values representing minutes of travel time [Nelson, 2008].
Download the 1km griddeddata:
afretep_etrs_1km_traveltime.zip ( ~ 50 Mb)
Download the source data:
Estimated travel time to the nearest city of 50,000 or more people in year 2000 ( ~ 212 Mb)
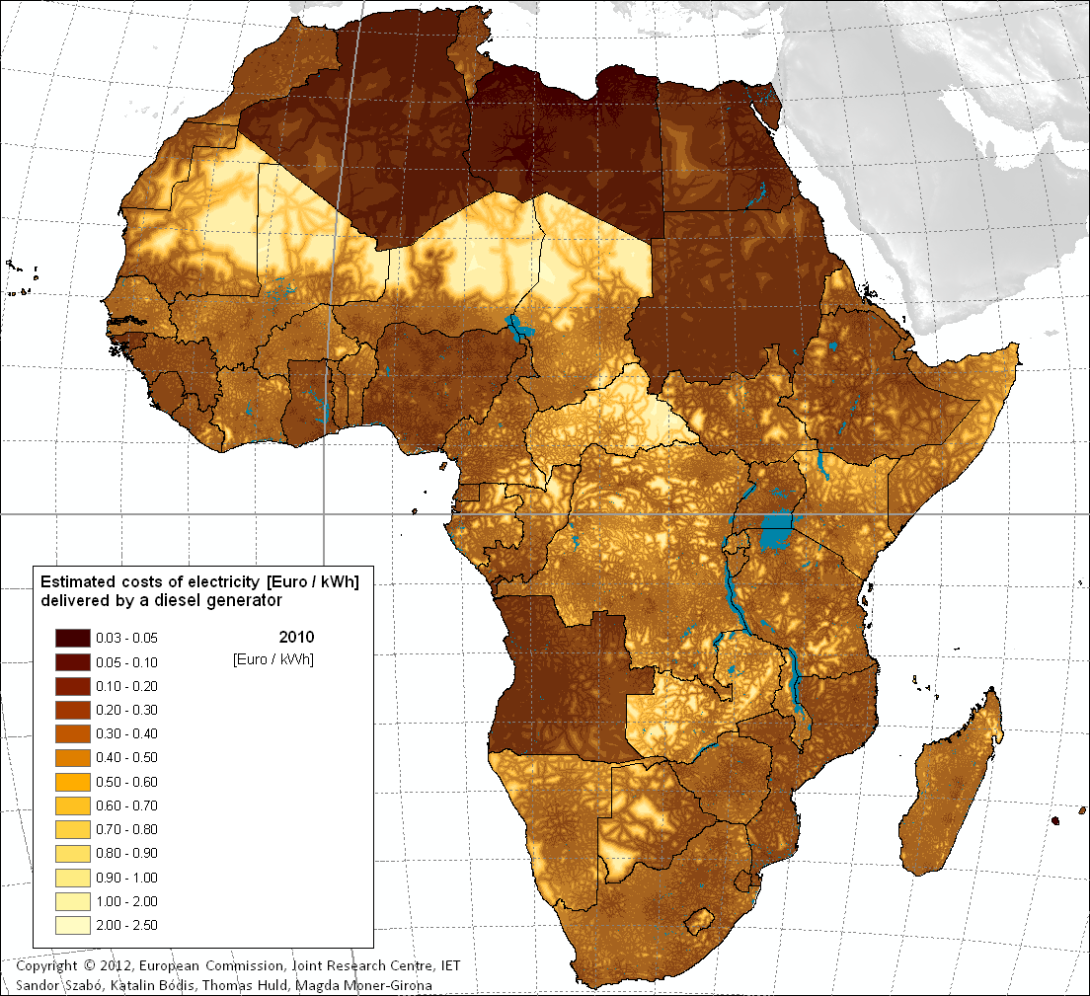
Estimated costs of electricity [Euro/kWh] delivered by a Diesel generator, 2010
The database of international diesel prices for 2008 and 2010 in African countries [S. Ebert et al., 2009, GTZ] was processed for further studies on evaluation energy solutions in rural Africa and mapping electrification costs of distributed solar and diesel generation versus grid extension [Szabó et al. 2011]. Depending on national taxes/subsidies, national average values ranged between 8 eurocent (Libya) and 113 eurocent (Malawi).
Download the 1km griddeddata:
afretep_etrs_1km_diesel_2010.zip ( ~ 16 Mb)
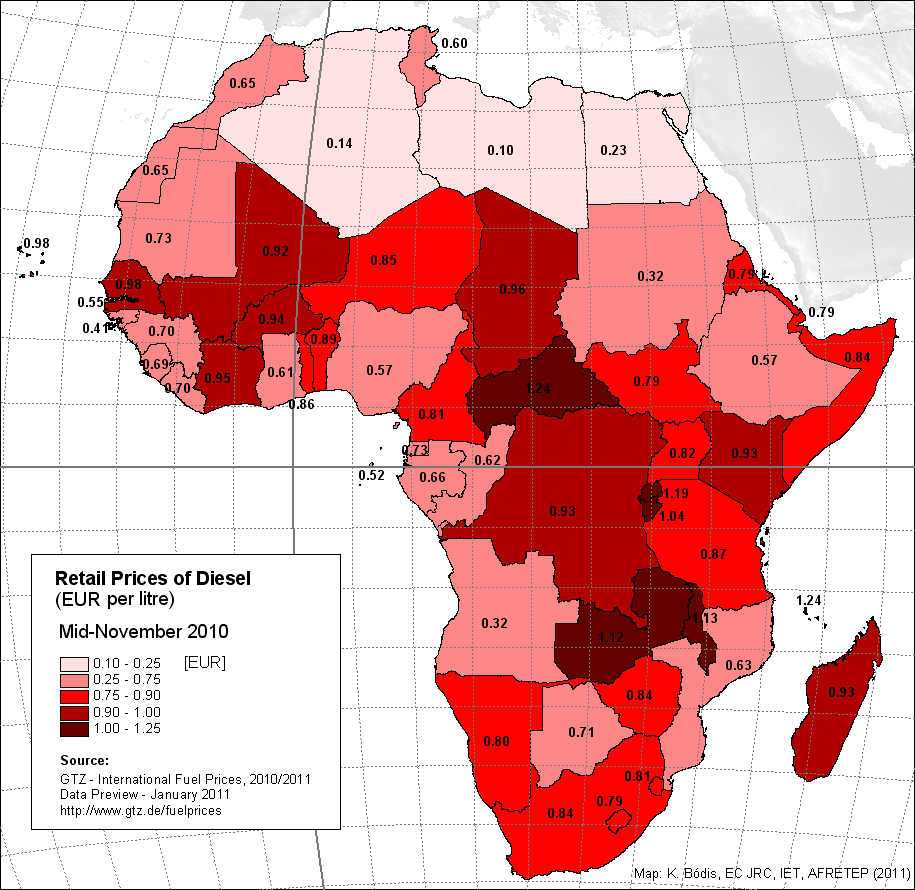
Map of international Diesel prices, 2010
The GTZ database of international diesel prices is available also for 2010 [Armin Wagner, 2011, GTZ]. The map and the GIS data below show the retail prices of Diesel (EUR cents per litre) at Mid-November 2010 based on the GTZ data. More info: https://www.giz.de/expertise/html/4282.html
Depending on national taxes/subsidies, national average values ranged between 10 eurocent (Libya) and 124 eurocent (Central African Republic).
Download the shape file:
afretep_etrs_diesel_gtz2010.zip ( ~ 2.7 Mb)
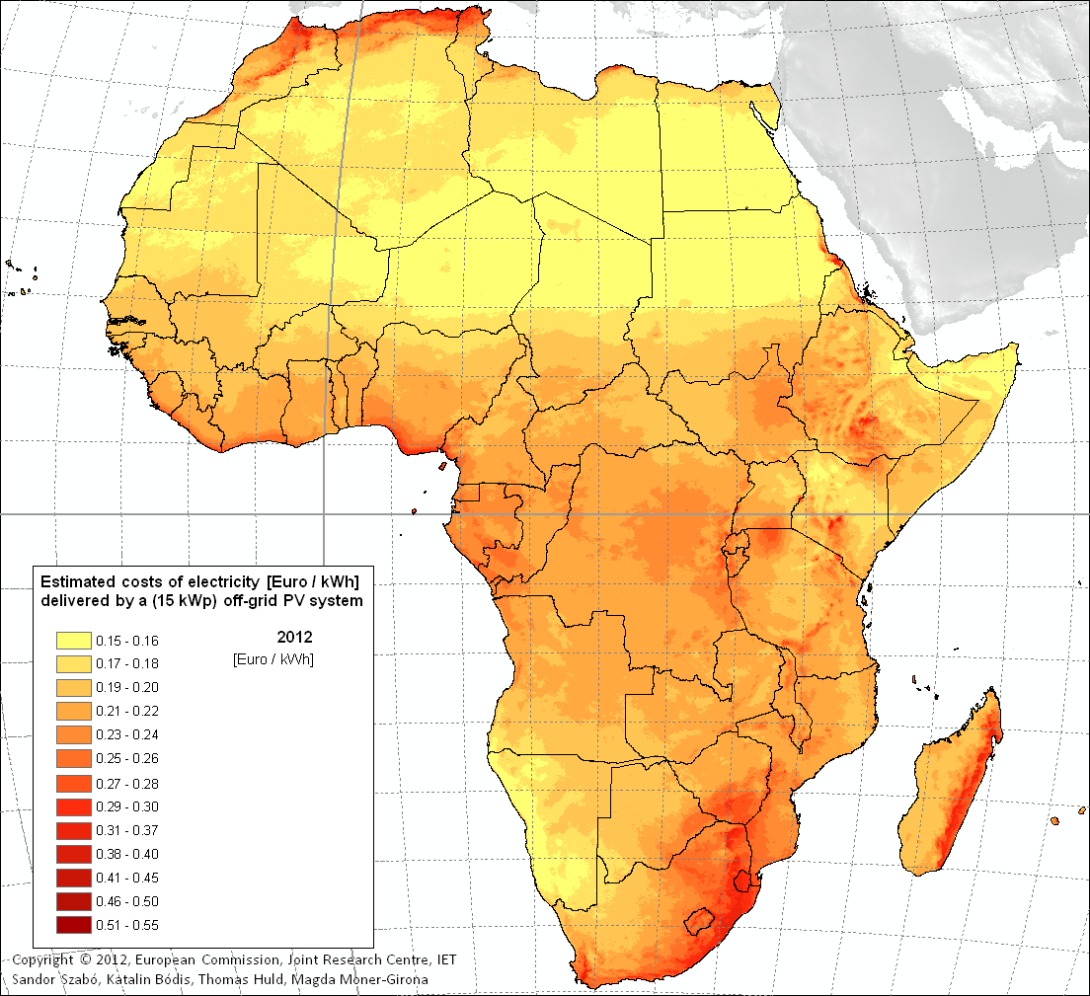
Map of estimated electricity production cost
The electricity production cost calculated for a 15kWp off-grid PV system in Africa ranges from 0.2 up to 0.55 EUR/kWh. Large geographical differences can be observed: some of the most favourable regions with low costs have very low population density (e.g. Sahara with 0-15 persons/km2) while at other are relatively densely populated (e.g. Tanzania, South Africa with 30-100 persons/km2).
Further information:
Photovoltaic Geographical Information System (PVGIS), Geographical Assessment of Solar Resource and Performance of Photovoltaic Technology
Huld T., Šúri M., Dunlop E., Albuisson M, Wald L (2005). Integration of HelioClim-1 database into PVGIS to estimate solar electricity potential in Africa. Proceedings from 20th European Photovoltaic Solar Energy Conference and Exhibition, 6-10 June 2005, Barcelona, Spain.
Download the 1km griddeddata:
afretep_etrs_pv_eurkwh_2010.zip ( ~ 6 Mb)
afretep_etrs_pv_eurkwh_2012.zip (~ 4.2 Mb)
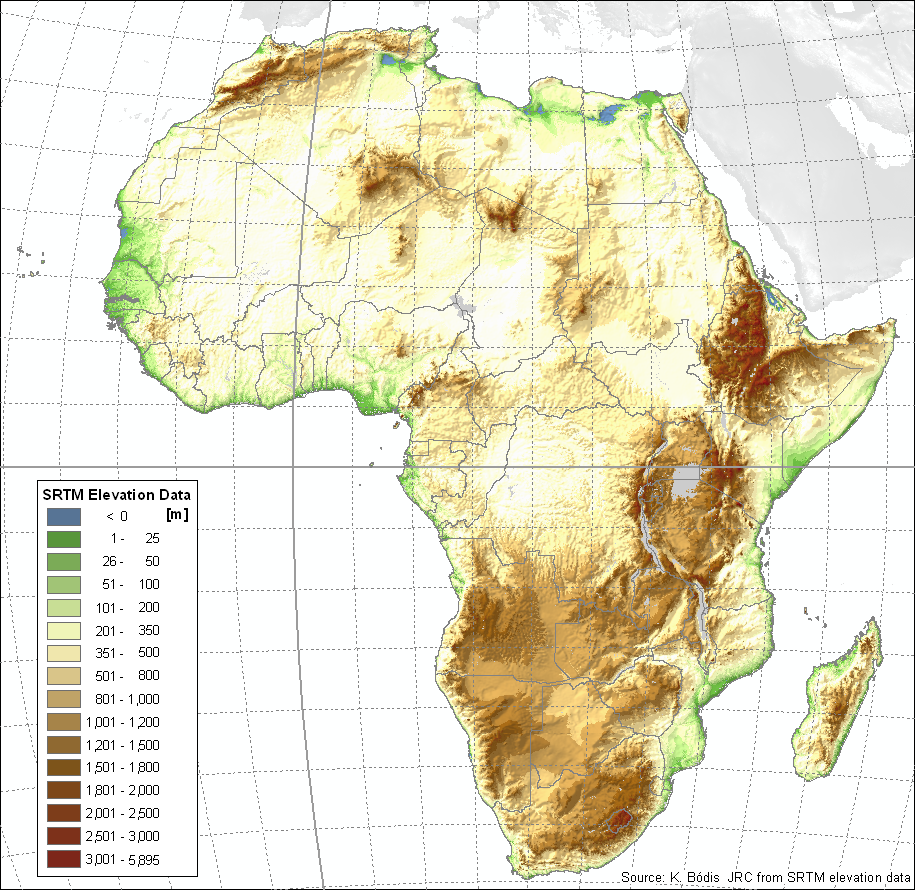
PHYSICAL GEOGRAPHICAL DATA LAYERSDigital Elevation Model
The Shuttle Radar Topography Mission (SRTM) obtained elevation data on a near-global scale (between N60 and S57 degree) to generate the most complete high-resolution digital topographic database of Earth. The project was a joint endeavour of NASA, the U.S. National Geospatial-Intelligence Agency (NGA), and the German and Italian Space Agencies, and flew in February 2000. It used dual radar antennas to acquire interferometric radar data (IFSAR), processed to digital topographic data at 1 arc-sec resolution [Farr et al., 2007]. According to the NASA-NGA agreement on data distribution the SRTM data has been released in 3 arc-sec (~90 m) resolution for areas outside the United States and full resolution 1 arc-sec (~30 m) for the area of the United States. The SRTM data as a public topographic database may be obtained through the Internet. Besides the elevation data the appropriate documentation and references are also available. The "highest quality SRTM data set" is available from the website of the Consortium for Spatial Information (CGIAR-CSI): http://srtm.csi.cgiar.org. The SRTM data was processed (projected and resampled ETRS Lambert 18,0 - 500 m, 1000 m) and applied for terrain modelling (estimated mean gradient).
Download the processed data:
afretep_etrs_500m_srtm.zip ( ~ 172 Mb) - Currently not available!
Download the source data:
CGIAR-CSI - http://srtm.csi.cgiar.org (Link to the global database of the Consortium for Spatial Information)
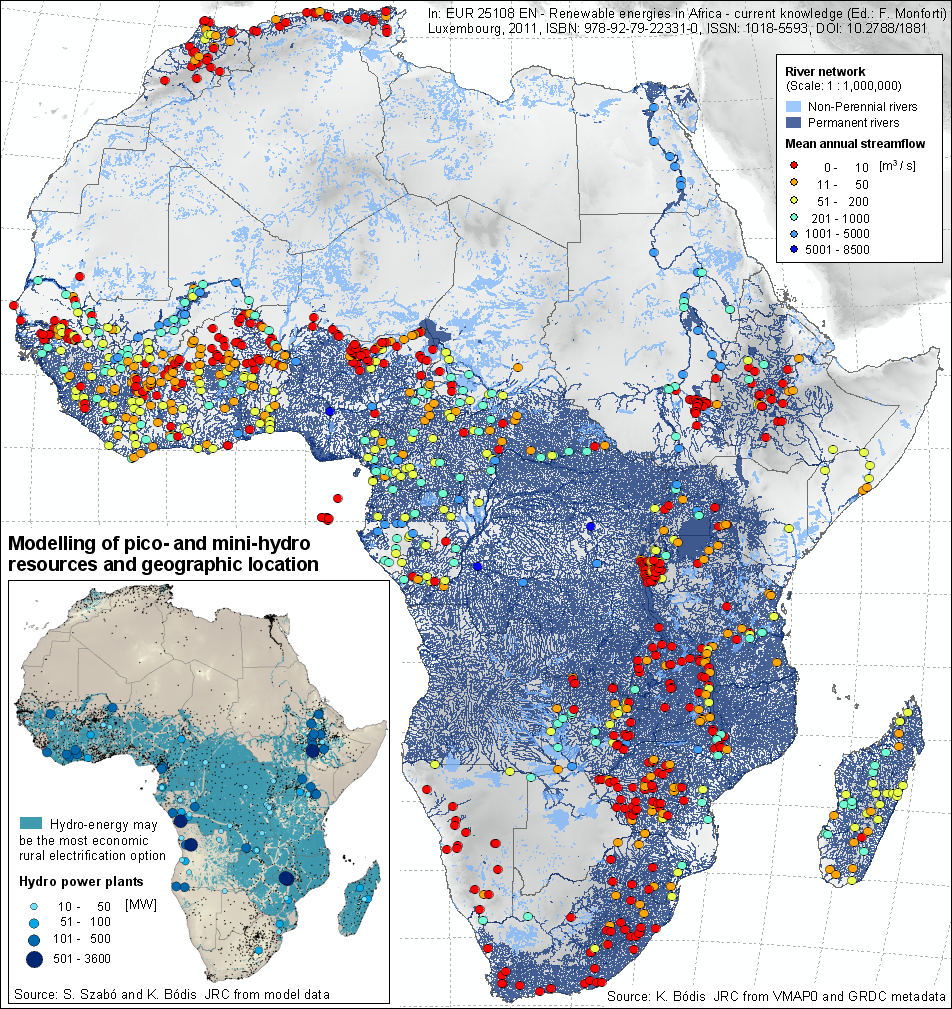
River network
The African coverage of two global flow and river network databases had been processed and analysed in the study on pico- and mini-hydro energy resources.
The 1:1 million Vector Map (VMap0) Inland Water and Water Course data layers for Africa provided the basic geographic information on different water bodies (polygons and polylines). The stored hydrographic description of features (Perennial/Permanent, Non-Perennial/Intermittent/Fluctuating) formed the basis of first delineation of river segments potentially appropriate for electricity production using pico- and mini-hydro systems.
Considering the characteristics and technical limitations of the VMAP0 data an additional hydrographic dataset designed for continental and global-scale applications had been involved into the study;
HydroSHEDS is based on high-resolution elevation data SRTM data. The consistent product of HydroSHEDS project offers a suite of geo-referenced data sets (vector and raster) at various scales, including river networks, watershed boundaries, drainage directions, and flow accumulations. The applied resolution was 3 arc-seconds (approx. 90 meters at the equator).
The source data depicted all linear downflow as 'river course' where the upstream catchment area was more than 1000 cells (approximately 8 km2 at the equator). During our GIS processing and analysis the real size of the watersheds had been calculated in square kilometers based on the geographical location (latitude) of cells belonging to each basin. The metadata of gauging stations (catchment size and mean annual discharge) from the Global Runoff Database at Global Runoff Data Centre was applied as control data.
Based on the description of almost 8000 stations globally and the mentioned river data, river segments fulfilling the following criteria had been selected as potential locations of mini hydro-systems:
- permanent river (info: VMAP0)
- river gradient or surface gradient along the river > 1 % (derived from SRTM30)
- catchment size > 100 km2 (calculation based on HydroSHEDS)
- mean annual stream flow > 4 m3/s (GRDC)
The processed GIS data were further analysed calculation the costs of system installation.
Download the source data:
VMap0 data in ESRI shape format (Description and ready to download)
CGIAR-CSI - http://srtm.csi.cgiar.org (Link to the global database of the Consortium for Spatial Information)
Global Runoff Data Centre (Link to the Global Runoff Database)
HydroSHEDS (Link to the USGS HydroSHEDS pages)
Land Cover
The Global Land Cover 2000 (GLC2000) database [GEM, 2003] has been chosen to model the land cover. The general objective of the GLC2000 was to provide a harmonized land cover database covering the whole globe for the year 2000 to the International Convention on Climate Change, the Convention to Combat Desertification, the Ramsar Convention and the Kyoto Protocol. The GLC2000 project used the FAO Land Cover Classification System (LCCS) which differs from the classes applied in CORINE. The source data is defined by geographic coordinates (Lat/Lon, WGS84). The spatial resolution is ~1km at the Equator (0.00833 decimal degrees). The source data was projected and resampled into the common reference system (ETRS Lambert 18,0 - 1000 m).
Download the source data:
Global Land Cover 2000 - Products (Link to the Global Land Cover 2000 Project)
Last modification: 01-07-2016
More info: Katalin Bódis (JRC C.2)