#️⃣ Creating Tables for data presentation
0
Tables are useful for organising and presenting content in a structured and easy-to-understand format. Whether displaying quantitative data, comparisons, or schedules, tables ensure that the content is organised, accessible, and engaging.
| ✅ Best Practices for Using Tables ✅ |
| Keep It Simple: Ensure your tables are easy to read by keeping the design simple and avoiding unnecessary clutter. Use clear and concise information that users can easily digest. |
| Use Consistent Formatting: Consistent formatting helps users understand the table at a glance. Align text, numbers, and other data neatly, and keep the design uniform across all your tables. |
| Highlight Key Data: Use bold text or shading to highlight important data points, such as column headers or significant figures. This helps draw attention to critical information. |
| Create Descriptive Titles: Label the first row of each column with clear, descriptive titles. This helps users instantly understand the content of the table and makes it more dynamic. |
| Organise Data Logically: Arrange the information in a logical order, such as alphabetically, by size, or by importance, depending on the data. This makes it easier for users to follow the flow of the content. |
Practical Examples for Using Tables in Groups 👇
- Using Tables for Data Presentation and comparisons
Tables are particularly useful for presenting and comparing data. - Using Tables for Schedules
When presenting timelines or schedules, tables provide a clear structure. - Using Tables for Summarising, Highlighting or Listing Information
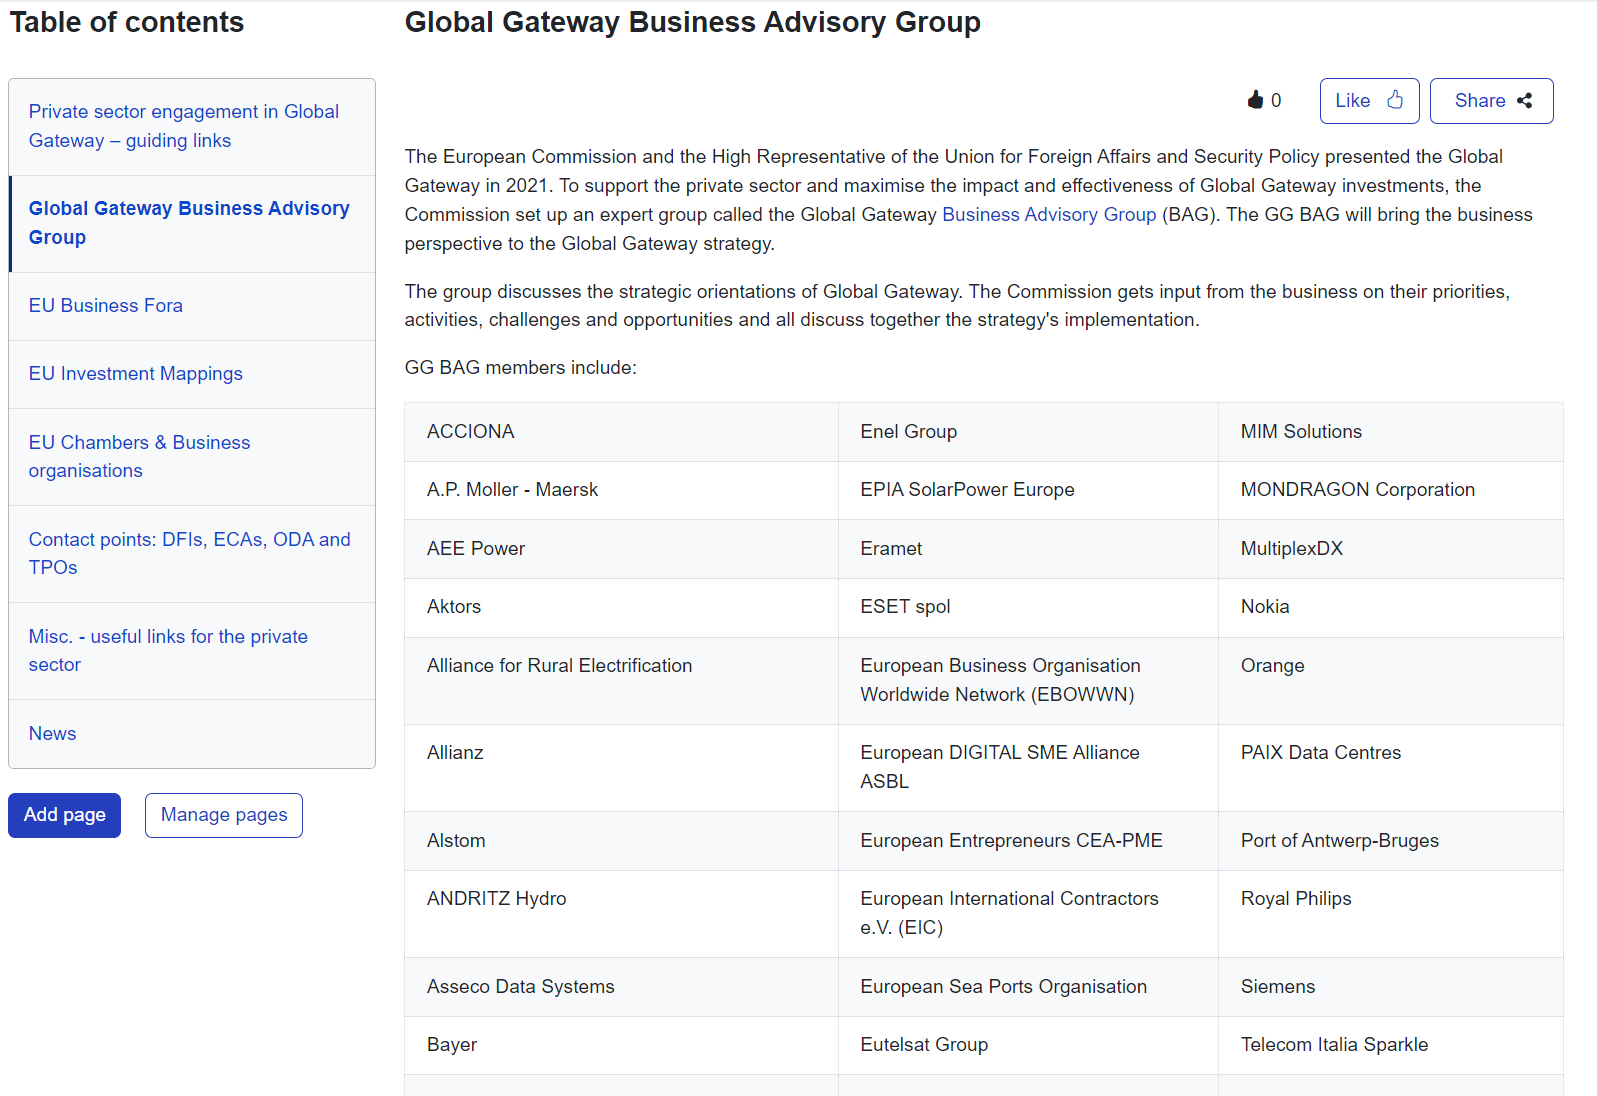
Tables can also be used to summarise detailed information in a highlighted way that is more appealing for readers. One example is how the EU Private Sector Engagement group applies a table to list the members of the Global Gateway Business Adivsory Group, in alphabetical order:
Image

| Having trouble formatting your text? Check our 🌐 Help & Support page 🌐 for a detailed step-by-step. |
With tables now helping to organise and present your data clearly, it's time to explore how adding anchors can improve navigation on longer pages. Let’s dive into using anchors to help users quickly access key sections of your content.
