📸 Embedding Images
Embedding images in web content is an effective way to improve a page's visual appeal and communicate information more clearly. Images grab attention and make complex details easier to understand.
| ✅ Best Practices for Embedding Images ✅ |
| Relevance: Ensure that the images directly relate to the content to avoid confusion. |
| High Quality: Use clear, high-resolution images for a professional appearance. |
| Descriptive Alt Text: Always fill in correctly your alternate text for accessibility and Search Engine Optimisation (SEO) purposes. |
| Optimisation: Even high quality images can be compressed to ensure fast loading times and improve user experience. |
Practical Examples of Effective Use of Images in Web Content 👇
1. Using Headers and Footers for Branding
Incorporate your organization's or project's logo and branding elements in the headers and footers. This creates a consistent brand presence and strengthens brand recognition throughout your group. For instance, the first info page of the EU Private Sector Engagement group uses a header correspondent to the Global Gateway strategy, reinforcing the connection to the broader initiative.

2. Using Exemplifying Images
Break up long paragraphs of text with images that support and exemplify the content. For instance, if you are explaining a process or a concept, a relevant diagram or photograph can visually guide the user through the idea, improving understanding.
Taking the example from a private group, which uses an image to map all the health components across other SDGs, besides the SDG number 3; the user is drawn to the visual scheme for better understanding.

3. Using Infographics to Summarize or Compile Information
Infographics are an effective way to convey complex information or data in a compact, easy-to-understand format. Use them to summarize key points, present statistics, or compile data visually. This can be especially helpful when explaining a step-by-step process or providing a detailed overview of a topic.
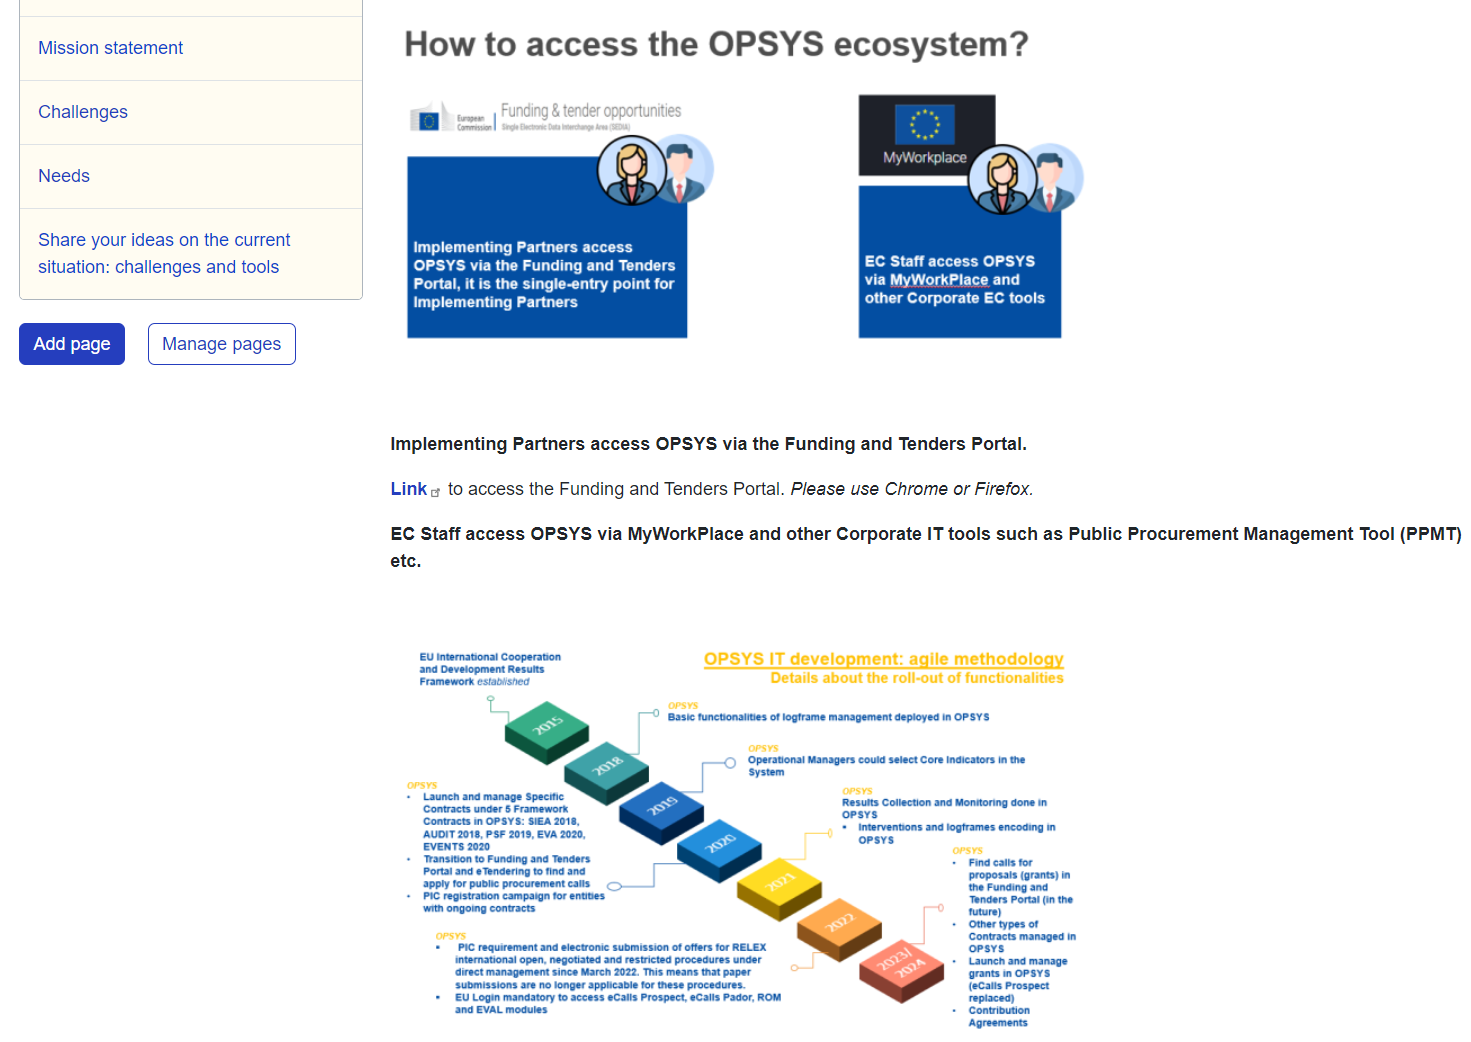
For example, the first info page of the OPSYS group features a diagram illustrating the OPSYS agile methodology, showcasing the rollout of functionalities developed by the IT team.

4. Using Graphics to Present Data
Charts, graphs, and other visual data representations make it easier for users to process and interpret numerical or complex data. Instead of overwhelming the reader with raw numbers, use a bar chart, pie chart, or line graph to present the data visually, enhancing clarity and impact.
| Having trouble embedding images? Check our 🌐 Help & Support page 🌐 for a detailed step-by-step. |
Now that you've mastered embedding images to enhance your pages, it's time to explore how videos can take your content even further. Jump to the next session here.
